
In this article, we will explore the world of digital marketing and provide you with an introduction to this highly-discussed topic on the internet. So, what exactly is digital marketing? It refers to the collective efforts made to promote products or services using electronic devices or internet bandwidth. Digital marketing encompasses a wide range of channels including Google Search Engine (SEO), social media platforms like Instagram and Facebook, email, and other third-party websites that are utilized to connect with prospects and customers.

Have you recently come across icons like these in the photo on the right? If not, perhaps you conducted an informational search on Google today, or maybe you visited a local business website and noticed a few of these icons (such as Instagram, Twitter, Facebook, or TikTok). Either way, you are now a part of the digital world, along with over 4 billion other individuals across the planet. With over 40% of the world’s population online at some point or another, this presents a huge marketing opportunity for you and your small business.
Digital marketing encompasses all of this and more, and by the end of this article, my goal is to provide you with a basic understanding of what it is, its vast scope, its importance, and why so many businesses have decided to take part in this digital world and make digital marketing a part of their overall marketing strategy.
Digital Marketing Statistics, What are 4 Billion People Doing Online?
Let’s dive into some digital marketing statistics and take a closer look at what the 4.54 billion people online (59% of the world population) are doing. Since January 2019, we’ve seen an increase of approximately 320 million internet users (Source: Statista.com).. But what exactly are these people doing online and how can we categorize them? Here are some noteworthy statistics to consider:
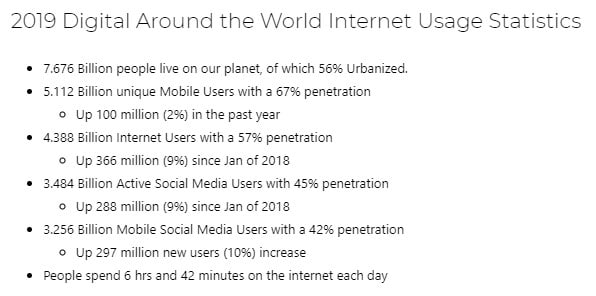
2021/2022 Digital Around the World Internet Usage Statistics
- 7.8 Billion people live on our planet, of which 56.2% are Urbanized.
- 5.19 Billion unique Mobile Users with a 67% penetration
- Up 100 million (2%) in the past few years
- 4.54 Billion Internet Users with a 59% penetration

2019 Global Digital Statistics (Total Internet Usage) - Up 366 million (9%) since Jan of 2018
- 3.484 Billion Active Social Media Users with 45% penetration
- Up 288 million (9%) since Jan of 2018
- 3.80 Billion Active Mobile Social Media Users with a 49% penetration
- Up 297 million new users (10%) increase
- People spend 6 hrs and 42 minutes on the Internet each day
- People spend 2 hrs and 24 minutes on social media alone
What are the most visited websites globally?
- Top 20 Visited Websites Globally in 2021/2022
- YouTube
- Baidu
- Wikipedia
- Tencent QQ
- Amazon
- Taobao
- Sina Corp
- VK
- Microsoft
- Sohu
- Netflix
- Alibaba Group
- Microsoft Office
Honorable Mentions
-
- Instagram (30th)
- Bing (32nd)
- Microsoft (33rd)
- Twitch (34th)
- Aliexpress (40th)
- Tribunnews (44th)
- Twitter (45th)
- eBay (47th)
Source: Alexa.com (2021 Report)
How are People Using the Internet?
- Top Most-Used Social Media Platforms 2021
According to the latest data, people are using the Internet for a variety of purposes including social media, entertainment, shopping, and communication. Here are some of the top apps, sites, and social media platforms people are using in 2023:
- Facebook – With over 2.8 billion monthly active users, Facebook remains the most popular social media platform in the world.
- YouTube – The video-sharing platform has over 2.3 billion monthly active users and is a popular source of entertainment and information.
- Instagram – The photo and video-sharing app has over 1.3 billion monthly active users and is particularly popular among younger generations.
- TikTok – The short-form video app has over 1.2 billion monthly active users and has rapidly gained popularity in recent years.
- WhatsApp – The messaging app has over 2 billion monthly active users and is popular for its end-to-end encryption and ease of use.
- Amazon – The e-commerce giant is the most popular online shopping site in the world, with millions of users making purchases every day.
- Twitter – The social media platform has over 340 million monthly active users and is popular for its real-time news and information.
- LinkedIn – The professional networking site has over 800 million users and is popular for job searches and business networking.
- Snapchat – The photo and video-sharing app has over 500 million monthly active users and is popular among younger generations for its fun filters and features.
- Netflix – The streaming platform has over 300 million subscribers and is a popular source of entertainment.
Other popular apps and sites include Google, Pinterest, Reddit, Spotify, and Zoom, which have all seen significant increases in usage in recent years.
Source: Hootsuite (2021 Report)
Social Media Growth By Country – Top 10
- Top 10 Social Media Growth by Country as of 2023
-
- India
- Indonesia
- China
- Nigeria
- United States
- Brazil
- Pakistan
- Bangladesh
- Mexico
- Philippines
2021 Total Social Media Audience Profile
- 13 to 17 Years Old
- 3% Male
- 4% Female
- 18 to 24 Years Old
- 11% Male
- 16% Female
- 25 to 34 Years Old
- 13% Male
- 19% Female
- 35 to 44 Years Old
- 7% Male
- 9% Female
- 45 to 54 Years Old
- 5% Male
- 5% Female
- 55 to 64 Years Old
- 3% Male
- 3% Female
- 65+ Years Olds
- 2% Male
- 2% Female
Demographics by Social Media Application
Below are the top 8 social media apps based on their number of active users and downloads. These apps are analyzed according to various demographics including gender, income, education, age, and country.
| Social Media App | Gender | Income | Education | Age | Country |
|---|---|---|---|---|---|
| 56% Female, 44% Male | 30% under $30,000, 30% $30,000-$74,999, 33% $75,000+ | 74% some college or more | 25-34 years old | United States, India, Brazil | |
| 57% Female, 43% Male | 32% under $30,000, 42% $30,000-$74,999, 27% $75,000+ | 42% some college or more | 25-34 years old | United States, India, Brazil | |
| TikTok | 60% Female, 40% Male | 40% under $30,000, 30% $30,000-$74,999, 30% $75,000+ | 34% some college or more | 10-29 years old | United States, China, India |
| 34% Female, 66% Male | 30% under $30,000, 30% $30,000-$74,999, 40% $75,000+ | 54% some college or more | 18-29 years old | United States, Japan, India | |
| 43% Female, 57% Male | 23% under $30,000, 35% $30,000-$74,999, 42% $75,000+ | 50% some college or more | 25-34 years old | United States, India, Brazil | |
| Snapchat | 61% Female, 38% Male | 47% under $30,000, 33% $30,000-$74,999, 20% $75,000+ | 49% some college or more | 13-24 years old | United States, India, France |
| 77% Female, 23% Male | 34% under $30,000, 30% $30,000-$74,999, 36% $75,000+ | 50% some college or more | 18-29 years old | United States, India, United Kingdom | |
| 48% Female, 52% Male | 36% under $30,000, 37% $30,000-$74,999, 27% $75,000+ | 24% some college or more | 18-34 years old | India, Brazil, Mexico |
Facebook Demographics 2021 / 2022
- By Gender
- 75% Female
- 63% Male
- By Income
- Less than $30k – 69%
- $30k to $74,999 – 72%
- $75k and greater – 74%
- By Education
- High School Degree or Less – 61%
- Some College – 75%
- College and Greater – 74%
- By Age
- 13 to 17 Years Old – 51%
- 18 to 24 Years Old – 76%
- 25 to 30 Years Old – 84%
- 30 to 49 Years Old – 79%
- 50 to 64 Years Old – 68%
- 65 and Older – 46%
- By Country (Top 5)
- India – 260 Million
- United States – 180 Million
- Indonesia – 130 Million
- Brazil – 120 Million
- Mexico – 84 Million
Instagram Demographics 2021 / 2022
- By Gender
- 43% Female
- 31% Male
- By Income
- Less than $30k – 35%
- $30k to $74,999 – 39%
- $75k and greater – 42%
- By Education
- High School Degree or Less – 33%
- Some College – 37%
- College and Greater – 43%
- By Age
- 18 to 24 Years Old – 75%
- 25 to 30 Years Old – 57%
- 30 to 49 Years Old – 47%
- 50 to 64 Years Old – 23%
- 65 and Older – 8%
- By Country (Top 5)
- United States – 120 Million
- India – 80 Million
- Brazil – 77 Million
- Indonesia – 63 Million
- Russia – 44 Million
Twitter Demographics 2021
- By Gender
- 21% Female
- 24% Male
- By Income
- Less than $30k – 20%
- $30k to $74,999 – 20%
- $75k and greater – 32%
- By Education
- High School Degree or Less – 13%
- Some College – 24%
- College and Greater – 32%
- By Age
- 18 to 24 Years Old – 44%
- 25 to 29 Years Old – 31%
- 30 to 49 Years Old – 26%
- 50 to 64 Years Old – 17%
- 65 and Older – 7%
- By Country (Top 5)
- United States – 59.3 Million
- Japan – 45.7 Million
- United Kingdon (UK) – 16.7 Million
- Saudi Arabia – 14.35 Million
- Brazil – 12.15 Million
LinkedIn Demographics 2021 / 2022
- By Gender
- 24% Female
- 29% Male
- By Income
- Less than $30k – 10%
- $30k to $74,999 – 26%
- $75k and greater – 49%
- By Education
- High School Degree or Less – 9%
- Some College – 26%
- College and Greater – 51%
- By Age
- 18 to 24 Years Old – 17%
- 25 to 29 Years Old – 44%
- 30 to 49 Years Old – 37%
- 50 to 64 Years Old – 24%
- 65 and Older – 11%
- By Country (Top 5)
- United States – 167 Million
- India – 64 Million
- China – 49 Million
- Brazil – 41 Million
- United Kingdon (UK) – 28 Million
Pinterest Demographics 2021 / 2022
- By Gender
- 42% Female
- 15% Male
- By Income
- Less than $30k – 18%
- $30k to $74,999 – 27%
- $75k and greater – 41%
- By Education
- High School Degree or Less – 19%
- Some College – 32%
- College and Greater – 38%
- By Age
- 18 to 24 Years Old – 38%
- 25 to 29 Years Old – 28%
- 30 to 49 Years Old – 35%
- 50 to 64 Years Old – 27%
- 65 and Older – 15%
- By Country (Top 5)
- United States – 79.4 Million
- Germany – 12.5 Million
- France – 10.76 Million
- United Kingdon (UK) – 10.6 Million
- Canada – 8.25 Million
Snapchat Demographics 2021 / 2022
- By Gender
- 24% Female
- 24% Male
- By Income
- Less than $30k – 27%
- $30k to $74,999 – 26%
- $75k and greater – 22%
- By Education
- High School Degree or Less – 22%
- Some College – 29%
- College and Greater – 20%
- By Age
- 18 to 24 Years Old – 73%
- 25 to 29 Years Old – 47%
- 30 to 49 Years Old – 25%
- 50 to 64 Years Old – 9%
- 65 and Older – 3%
- By Country (Top 5)
- United States – 101.2 Million
- India – 22.9 Million
- France – 21.2 Million
- United Kingdon (UK) – 18.7 Million
- Saudi Arabia 16.1 Million
YouTube Demographics 2021
- By Gender
- 68% Female
- 78% Male
- By Income
- Less than $30k – 68%
- $30k to $74,999 – 75%
- $75k and greater – 83%
- By Education
- High School Degree or Less – 64%
- Some College – 79%
- College and Greater – 80%
- By Age
- 18 to 24 Years Old – 90%
- 25 to 29 Years Old – 93%
- 30 to 49 Years Old – 87%
- 50 to 64 Years Old – 70%
- 65 and Older – 38%
- By Country (Top 5)
- United States – 167.4 Million
- Brazil – 69.5 Million
- Russia – 47.4 Million
- Japan – 46.8 Million
- India – 21.2 Million
TikTok Demographics 2021 / 2022
- By Gender
- 44% Female
- 55% Male
- By Income
- Less than $30k – 68%
- $30k to $74,999 – 75%
- $75k and greater – 83%
- By Education
- High School Degree or Less – 64%
- Some College – 79%
- College and Greater – 80%
- By Age
- 10 to 19 Years Old – 39.9%
- 20 to 29 Years Old – 26.1%
- 30 to 39 Years Old – 10.2%
- 39 to 49 Years Old – 16.8%
- 50 and Older – 6.5%
- By Country (Top 5)
- India – 467 Million
- China – 173.2 Million
- United States – 123.8 Million
- Turkey – 28.4 Million
- Russia – 24.3 Million
- By Downloads by Country (Top 5)
- India – 190.6 Million
- United States – 41.0 Million
- Turkey – 23.2 Million
- Russia – 19.9 Million
- Pakistan – 19.5 Million
Source(s): Statista | Oberlo | Hootsuite | SproutSocial
It can be quite surprising to realize how much time we as a society spend on the internet. It has been reported that we spend an average of 6 hours and 42 minutes per day online. Here is a list of 15 Countries with the Highest Number of Internet Users:
- Top 20 Countries with the Highest Number of Internet Users 2021 /2022
- United States – 95.4 Million
- Japan – 47.1 Million
- Germany – 24.0 Million
- China – 22.5 Million
- United Kingdom – 15.4 Million
- Italy – 13.2 Million
- France – 8.5 Million
- India – 5.0 Million
- Brazil – 5.0 Million
- Russia – 3.1 Million
- Mexico – 2.7 Million
- Thailand – 2.6 Million
- Indonesia – 2.0 Million
- Philippines – 2.0 Million
- Turkey – 2.0 Million
- Egypt – 450 Thousand
- Iran – 250 Thousand
- Nigeria – 200 Thousand
- Vietnam – 200 Thousand
- Bangladesh – 100 Thousand
Source(s): Hootsuite | InternetWorldStats
The above statistical data in simple terms means that millions of people are spending time online! That in itself should point out that it is clearly a HUGE opportunity for you and your business to be online and capitalize on this digital market. (SEO)
Digital Marketing Adspend (Budget)
Businesses are recognizing the importance of having a strong online presence and are investing heavily in digital marketing. This trend has been steadily increasing since 2014 and shows no signs of slowing down. In fact, entrepreneurs are willingly increasing their online ad budgets and paying for advertisements across multiple platforms. The graph below illustrates the significant rise in digital ad spend for lead generation, from 1.88 billion dollars in 2014 to 2.35 billion dollars in recent years.
Source: Statista.com


Total Country By Dollar Spent – Advertisement Expenditure
As it shows below the U.S. outspent all other countries on advertising at $197.47 Billion.
- Here are the top 10 countries based on Ad Expenditure:
- U.S. spends $197.47 Billion
- China spends $79.08 Billion
- Japan spends $41.85 Billion
- The United Kingdom spends $24.21 Billion
- Germany spends $22.74 Billion
- Brazil spends $14.89 Billion
- South Korea spends $12.13 Billion
- Australia spends $12.02 Billion
- France spends $11.95 Billion
- Indonesia spends $8.71 Billion
What Online Retail Categories Receive the Highest Advertisement Budgets?
The following list reflects where the majority of online advertisement budgets are invested in:
- Retail – 21.9%
- Automotive – 12.6%
- Financial Services – 12.2%
- Telecom – 10.7%
- CPG & Consumer Products – 8.8%
- Travel – 8.0%
- Computing Products & Consumer Electronics – 7.8%
- Media – 6.1%
- Entertainment – 5.1%
- Health & Pharma – 2.6%
- Other – 4.3%
As reported, the trend of shifting more marketing dollars to digital channels will continue into the foreseeable future with projections estimating at almost 126 billion dollars (three times the increase) in total ad spend. So if you and your products are not being found, then it’s time to invest in Paid Search (SEO) which heavily falls on Google, Baidu, Yahoo, and Bing.
So now that we have discussed where our advertisement dollars are going, our next section will cover how these ads are being displayed.
")
Search Engine Results Page | Displaying Ads
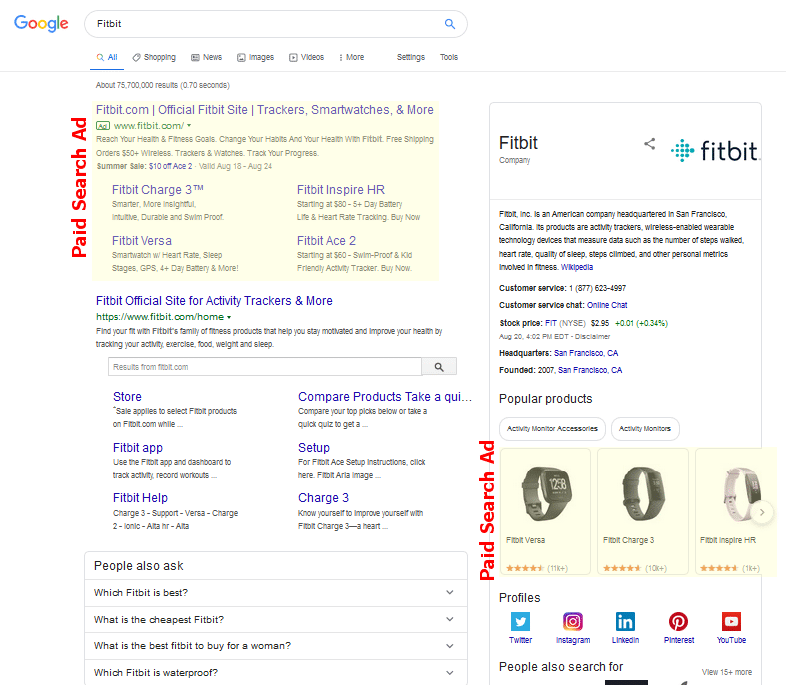
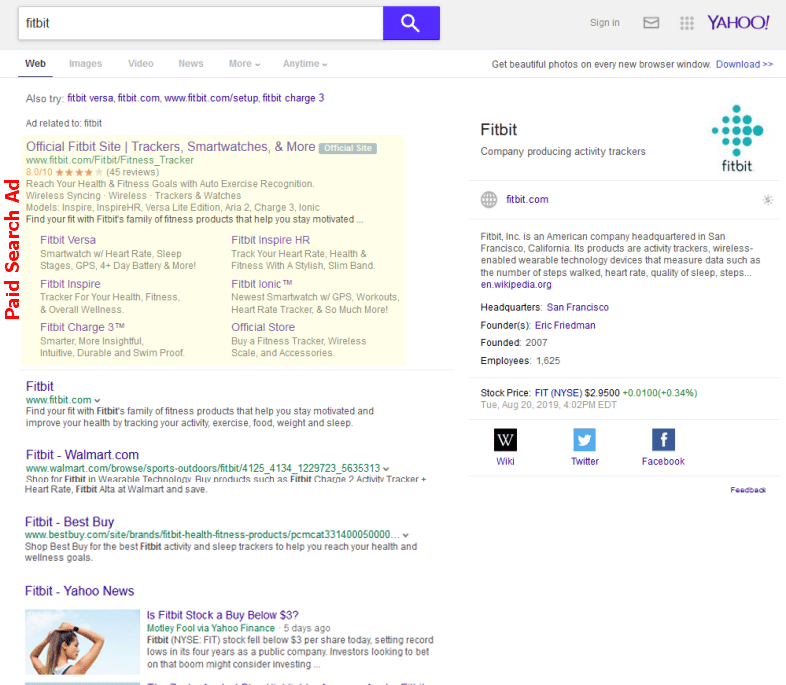
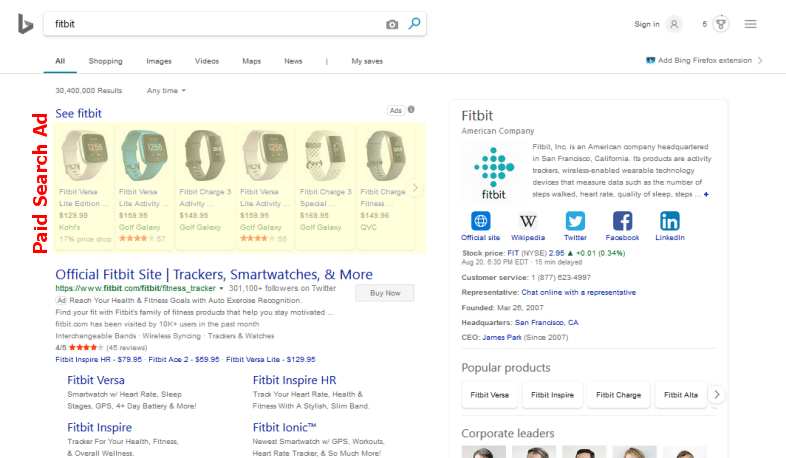
So how do Google and the other search engine platforms display these ads? I will take a moment and show you how Google, Baidu, Yahoo, and Bing display ads on their search engine results in pages for the query ‘FitBit‘.
So from the image listed below, I have highlighted the ad segments in yellow to assist in standing out from the other organic search results you see on the page.
Paid Advertisements as Shown On Google SERP
Paid Advertisements as Shown On Baidu SERP

Paid Advertisements as Shown On Yahoo SERP
Paid Advertisements as Shown On Bing SERP
Chasing Our Online Prospects and Why Should We Go Digital?
If the statistics haven’t shown you, then the answer lies with the evolution of technology. The business has been forced to change its business model and do whatever it can to stay afloat and keep up. Over the past 10 years, evolution has seen more brick-and-mortar establishments closing their doors and evolving into online entities. It has become a sink-or-swim situation for many.
Here are just a few businesses that closed their doors in 2017 & 2019:
- Toys ”R” Us — All stores
- Best Buy Mobile — All stores
- Claire’s – 92 stores (1%)
- Sam’s Club — 63 stores (11%)
- Abercrombie and Fitch — Another 60 stores (9%)
- Winn-Dixie, Harveys and Bi-Lo — 94 stores (16%)
- Foot Locker — 110 stores (3% of stores)
- Sears and Kmart — 103 stores combined (11% of stores)
- Bon-Ton — 47 stores (16%)
- Wet Seal — All stores (online still operating)
- hhgregg — All stores (online still operating)
- The Limited — All stores (online still operating)
- Bebe — All stores (online still operating)
- Radio Shack — 552 stores (93%)
- The Children’s Place — 300 stores (71%)
- BCBG Max Azria — 120 stores (50%)
- Crocs — 158 stores (28%)
- Gymboree — 350 stores (28%)
- Payless Shoes — 1,000 stores (25%)
- Teavana — 77 stores (20%)
- Macy’s — 100 stores (15%)
- Michael Kors — 100 stores (15%)
- JCPenney — 138 stores (14%)
- Gap and Banana Republic — 200 stores (10%)
- J.Crew — 50 stores (9%)
- Staples — 70 stores (4.5%)
- Gamestop — 150 stores (3%)
- CVS — 70 stores (0.7%)
- Payless ShoeSource – 2,100 Closed in 2019
- Gymboree – 800 Closed in 2019
- Freds – 557 Closed in 2019
- Things Remembered – 200 Closed in 2019
- Walgreens – 200 Closed in 2019
- Forever 21 – 178 Closed in 2019
- Dressbarn – 650 Closed in 2019
- Family Dollar – 390 Closed in 2019
- GameStop – 200 Closed in 2019
- GAP – 230 Closed in 2019
Rewritten and enhanced: With the rise of online stores, brick-and-mortar stores are witnessing a decline in numbers every month. According to UBS Bank, an estimated 75,000 stores will be closed by 2026. However, there is an opportunity for businesses to stand out from this negative trend by adopting a simple strategy: transitioning from being solely a physical business to one that is more diverse, utilizing both offline and online channels. This is where digital marketing and SEO come into play. In the next section, I will discuss the top 10 reasons why businesses should embrace digital marketing and SEO strategies.
Now if you are looking at starting a business, then there is no better time to jump into the market. Contact Me
10 Reasons for Digital Marketing
The following reasons will show you why the use of digital marketing is not only a smart decision but also an effective marketing avenue that will help you grow your business.
- Digital Marketing levels the online playing field.
- Is more Cost-Effective than Traditional Marketing
- Digital Marketing Delivers Conversions
- Helps Generate Better Revenues and Profitability
- Easier to Facilitate Interaction with Targeted Audiences
- It tends to Cater to the Mobile Consumer (the Future of the Internet)
- Helps Build Brand Reputation
- Helps Achieve a Better ROI for your Marketing Investments
- Build Up Brand Trust and Recognition
- Entices Prospects to Take Action (Buy, Sign-up, &, etc)
What are the Objectives of Digital Marketing?
The objective of Digital Marketing is about bringing more leads, more sales, and increasing the bottom line of your business. Here are my top objectives for digital marketing:
Top Priorities (Objectives) for Digital Marketing?
- Increased Lead Generation
- Improved Lead Conversion Optimization
- Increased Sales Revenue
- Improve Brand Awareness and Recognition
- Improved Client / User Experience
- Increased Organic and PPC Website Traffic
- Improved Niche Content Marketing
- Social Media Awareness
What are the Top Tools for a Digital Marketer?
- Search Engine Optimization (SEO)
- OnPage and Offpage Optimization
- Technical SEO
- Organic Growth
- OnPage and Offpage Optimization
- Social Media Marketing (SMM)
- Brand Awareness through top Platforms
- Facebook
- Groups
- Fan Pages
- Snapchat
- Tumblr
- Facebook
- Brand Awareness through top Platforms
- Email Marketing
- Building Lead List
Behavioral Marketing: User Behavior Metrics
It cannot be helped that we are creatures of habit. People tend to fear change and stick to what they know and feel comfortable with. Psychologists have been tracking human behaviors going back to the 1800s with Wilhelm Wundt. Although we believe ourselves to be sophisticated and complex evolved beings, our core routines are filled with hundreds of habits and subconscious responses. These habits are what get us through the day and although we may think nothing of them, as a marketer we can identify those patterns (data points) and apply pressure to achieve the most desired outcome. Facebook in 2018, had over 52,000 data points on each and every person online.
What is Behavioral Marketing?
Behavioral marketing takes all the psychological user data available online and formulates it into a more definitive profile allowing marketers and businesses to pinpoint and target very niche-specific prospects.
Online Digital Marketing Opportunity
Today is the best day to start an online business! I am not saying to quit your job and jump headfirst into the digital marketing pool; however, today would be a great time to start working on some type of online business strategy. Our world will continue to change no matter what you decide. We all have had too many of the shoulds of’s running through our heads and I can say there are plenty of successful online business owners bringing in $300 to $3000 a month. What could you do with an extra $250 per month? Car payment? Utility bill? Save for that vacation? At this point, it is up to you.
Digital Marketing Overview | Article Summary
This brings us to the end of this article on Digital Marketing. Before you go, I would like to summarize (if at least nothing else);
- What is Digital Marketing?
- Digital Marketing is the total effort encompassing marketing that uses an electronic device or internet bandwidth. This covers all types of channels from Google Search Engine (SEO), Social Media (ie Instagram and Facebook), email, and other third-party websites used to connect with prospects and your customer base.
- Why Should Digital Marketing Matter?
- Our world is changing no matter if you decide to participate or not. Brick and Mortar business has been cutting back and shutting its doors at an alarming rate. If you want to be found online, you will need to implement some type of digital marketing strategy.
- An average person spends 6 hours and 42 minutes per day online (and climbing)
- Future projections anticipate almost 126 billion dollars in ad spend (3 times the current)
- Search Engines and websites will continue to display ads all over their network.
- Digital Marketing levels the playing field while generating leads, and brand awareness

